
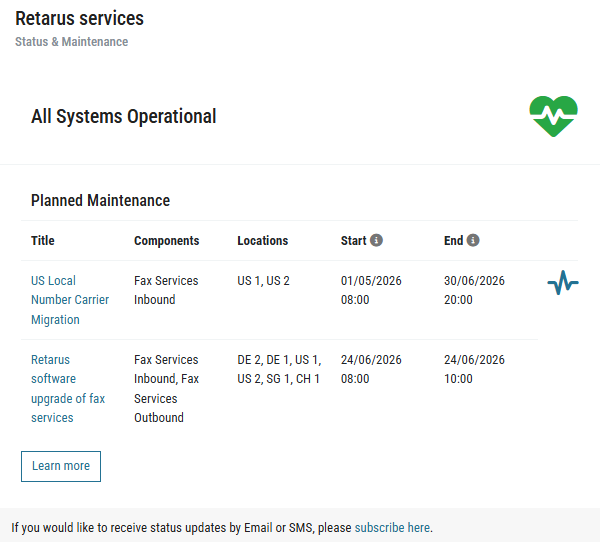
The Retarus services - Status & Maintenance dashboard section helps you monitor system health and stay informed about planned maintenance activities.
System status indicator
Located at the top of the section, the status indicator includes:
-
a status message (e.g., All Systems Operational)
-
a heart-rate icon—a visual indicator showing the current health status of Retarus services
Maintenance schedule
The maintenance table provides details about upcoming system updates:
|
Column name |
Description |
|---|---|
|
Title |
Names of scheduled maintenance tasks |
|
Components |
Affected Retarus services |
|
Locations |
Target data centers (e.g., DE 1, DE 2) |
|
Start |
Maintenance start time and date |
|
End |
Expected completion time and date |
Status updates and notifications
To receive detailed information about system status, click the Learn more button or follow the subscribe here link. These options take you to the official Retarus services page where you can:
-
Access detailed service health information
-
View complete maintenance schedules
-
Set up status notification preferences