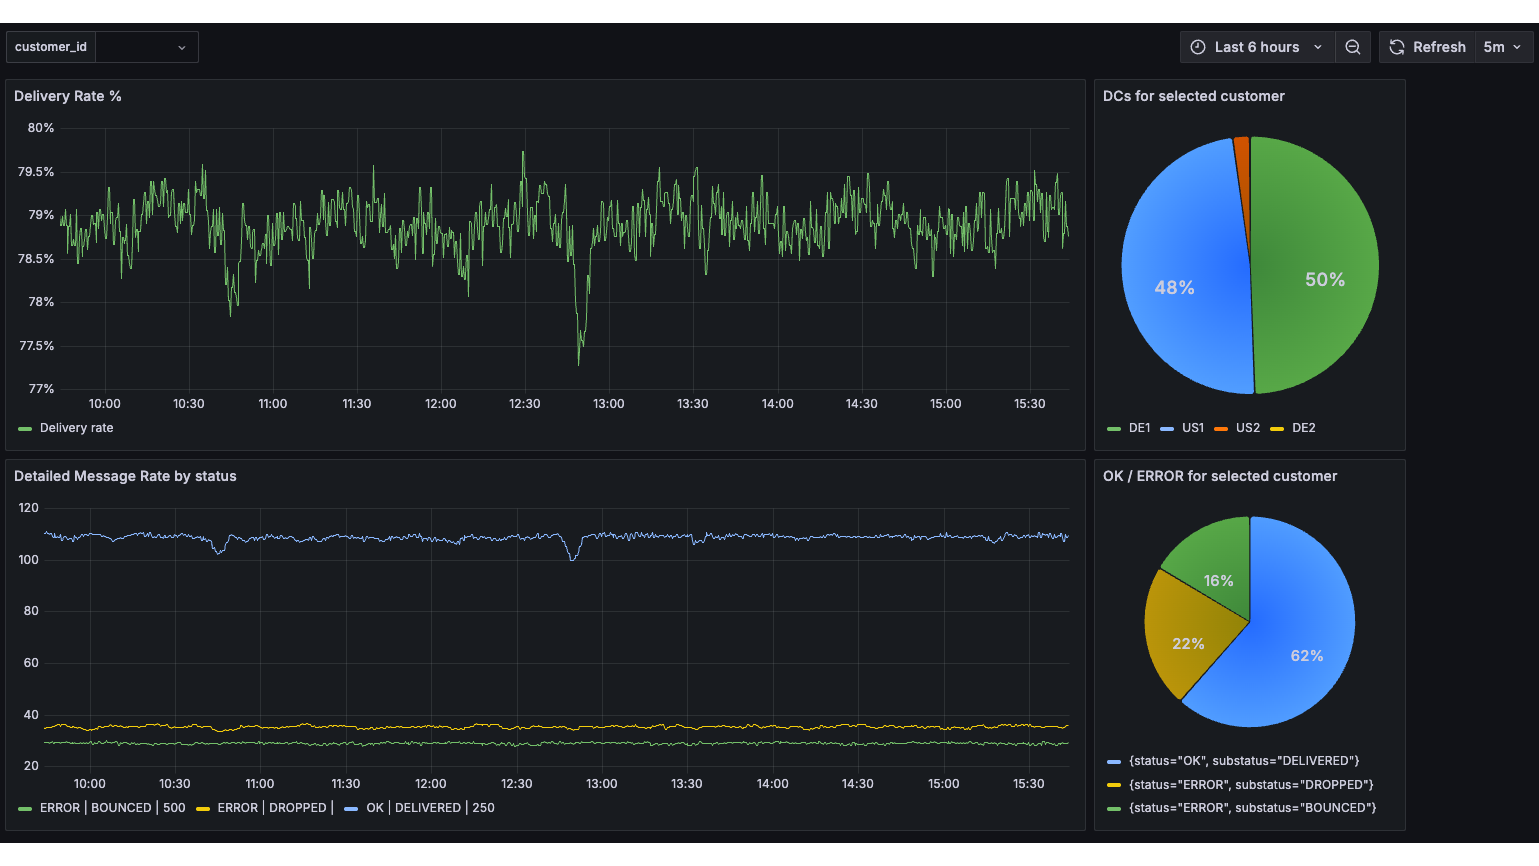
Observability Metrics provide insight into the health, performance, and behavior of Retarus services by exposing aggregated metrics that can be consumed by observability platforms. These metrics support monitoring, analysis, and alerting without requiring access to raw event data.
Observability platforms help organizations understand how applications, services, and infrastructure behave in real time. They collect and analyze telemetry data such as logs, metrics, events, and traces.

Gartner defines observability platforms as tools that provide deep, real-time visibility into system behavior. By analyzing telemetry data, these platforms enable both humans and automated systems to detect and address issues before they impact customers.
Observability Metrics focus on structured, time-based measurements that support dashboards, trend analysis, capacity planning, and threshold-based alerting.
Retarus Observability Metrics
Retarus provides Observability Metrics in the Prometheus exposition format, a widely adopted, text-based standard designed for efficient ingestion and processing.
The metrics consist of aggregated counters and timers rather than individual events. This approach reduces data volume while still providing meaningful insight into system performance and operational patterns.
For advanced use cases, metrics can be accessed through a Retarus-provided metrics endpoint and integrated into customer-managed observability platforms. This enables additional customization, fine-tuning, and extended analysis.
All supported products expose metrics using the same standardized format. Product-specific documentation describes available metrics, endpoints, authentication, and configuration details.
Benefits and supported platforms
Observability Metrics provide the following benefits:
-
Real-time visibility into system behavior
-
Standardized, ready-to-ingest metrics format
-
Integration into existing observability and monitoring platforms
-
Support for dashboards, alerts, and trend analysis
-
Low data volume due to aggregated metrics
Observability Metrics integrate with popular monitoring platforms such as Grafana, Datadog, Splunk, Dynatrace, Elastic, and New Relic. Most platforms that support Prometheus-compatible metrics should be able to consume the exposed data.
Observability Metrics FAQ
Product-specific documentation
Observability Metrics are supported by multiple Retarus products. While the data format and access model remain consistent, endpoints, available metrics, labels, and configuration steps differ by product.
For product-specific information, refer to: