
The Reporting function in myEAS helps you monitor and analyze your Electronic Data Interchange (EDI) transactions. You can view, filter, and customize your data to quickly find the information you need. The tool also allows you to export results for further offline work, making it a valuable resource for tracking your EDI processes.
Accessing and viewing reports
-
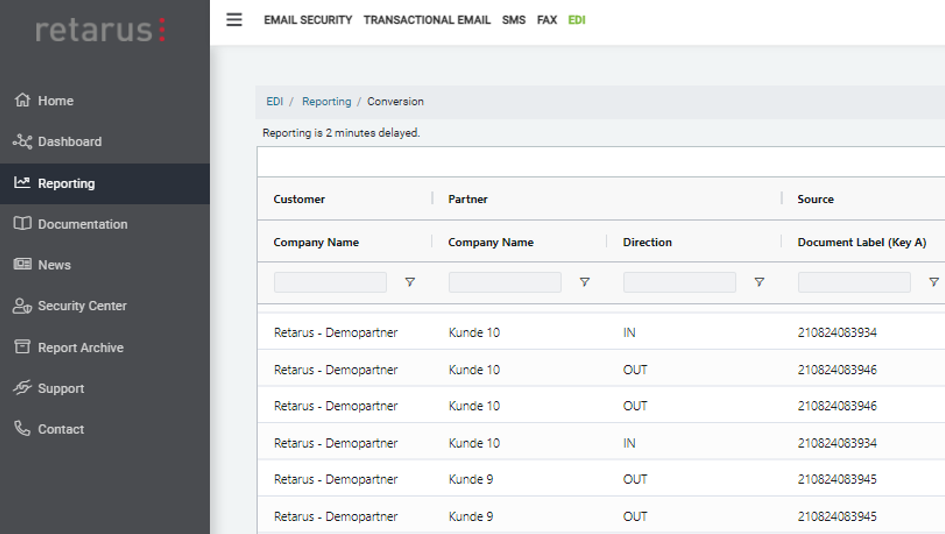
Click EDI in the top menu bar.
→ The Reporting window opens. -
Click Select under Conversions.
→ The Conversions screen opens, showing all available transactions.
Choosing an EDI Instance
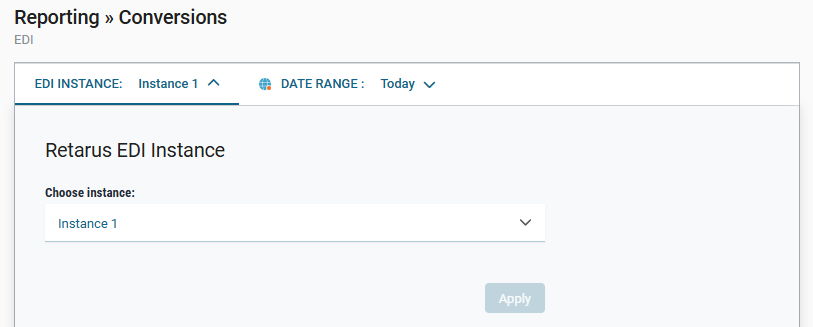
If your account has access to multiple EDI instances, you can select which one to view in the report.
-
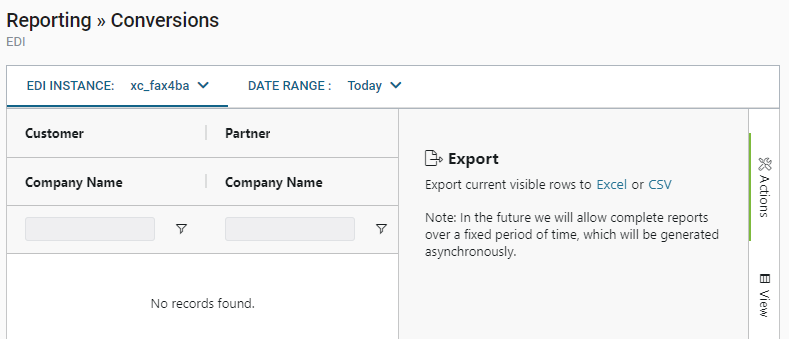
At the top of the Conversions screen, click the EDI INSTANCE dropdown.
-
Select the desired instance from the list.
-
Click Apply to load the report for the chosen instance.
📌 Displayed transactions and data
The instance you select determines which transactions and data appear in the report. Make sure you choose the correct one before applying filters or exporting results.
Setting a Date Range
You can limit your report to a specific time period.
-
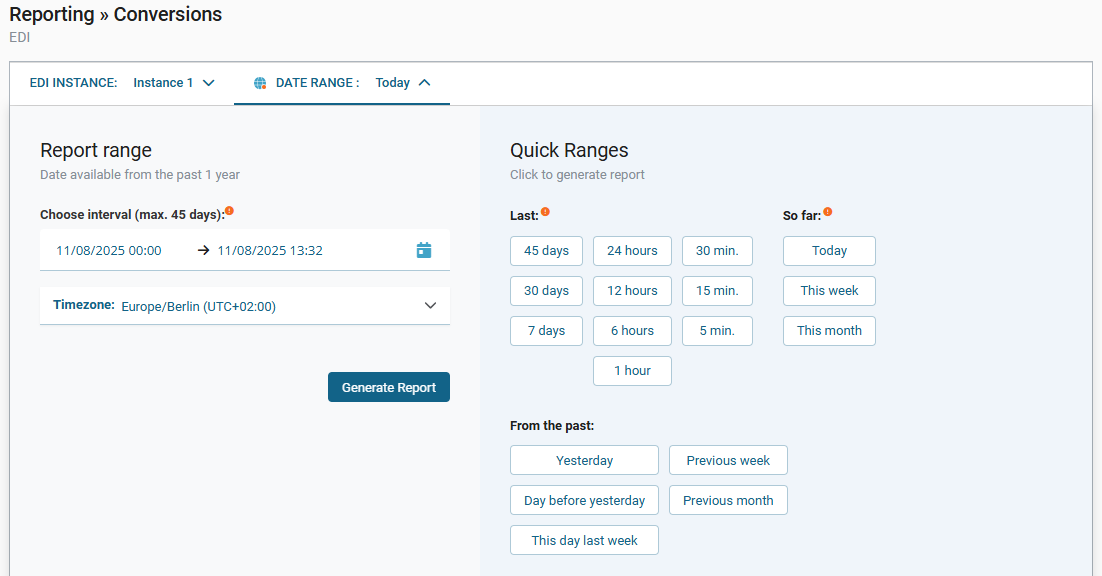
Click the DATE RANGE dropdown at the top of the Conversions screen.
-
Either:
-
Select a quick range (e.g., Today, This week, Last 7 days), or
-
Specify a custom interval by choosing start and end dates/times (up to 45 days).
-
-
Select your preferred time zone if needed.
-
Click Generate Report to apply the date range.
For more information, see Configure timezones and date ranges.
Configuring the display
You can tailor the report view to fit your workflow.
Showing and hiding columns
Adjust which columns appear in the report to focus on the most relevant data.
-
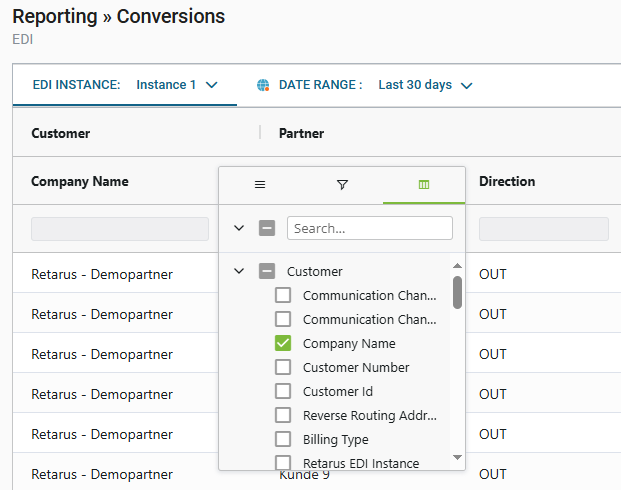
In the table header, hover over any column title (for example, Company Name).
-
Click the column settings icon (three stacked lines) that appears.
→ The popover menu opens. -
Click the Columns tab (represented by the grid icon).
→ A list of all available columns appears, grouped into categories such as Customer (customer-related identifiers) or Partner (partner-related identifiers).
-
Check the box next to a column to show it.
-
Clear the box to hide that column from the display.
→ The table updates immediately based on your selection—no need to refresh or reapply filters.
📌 Search field
Use the search field at the top of the column list to quickly find a specific column by name.
Pinning/resizing/resetting columns
-
In the table header, hover over any column title (for example, Company Name).
-
Click the column settings icon (three stacked lines) that appears.
→ The popover menu opens.
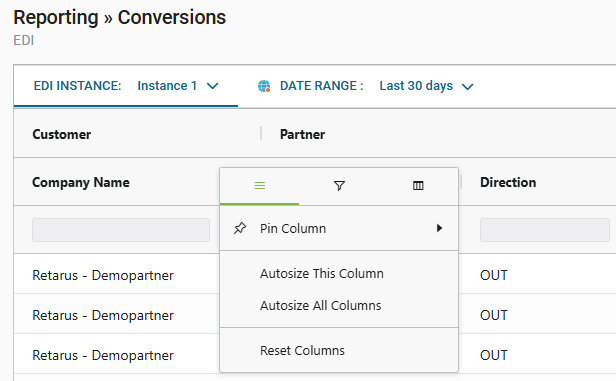
-
Hover over Pin Column, then choose:
-
No Pin – Removes pinning.
-
Pin Left – Locks the column to the left side of the table.
-
Pin Right – Locks the column to the right side of the table.
-
In the same column settings menu, you can:
-
Resize columns:
-
Autosize This Column – Adjusts the selected column’s width to fit its contents.
-
Autosize All Columns – Adjusts all columns’ widths to fit their contents.
-
-
Reset columns
-
Restores all columns to their original default order, visibility, and size.
-
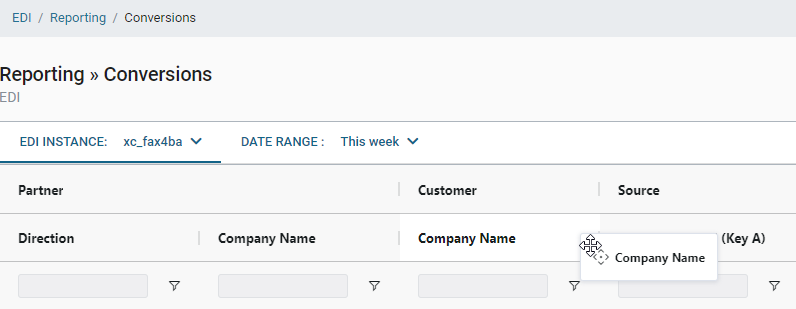
Rearranging columns
Change the order of columns in the report to match your preferred workflow.
-
Move your mouse pointer over the column header you want to move (for example, Company Name).
-
Click and hold the left mouse button.
-
While holding the button, start moving the cursor slightly to the left or right.
-
The move cursor (crossed arrows) appears.
-
-
Continue dragging the column header to the desired position.
-
A visual placeholder shows where the column will be placed.
-
-
Release the mouse button to drop the column in its new position.
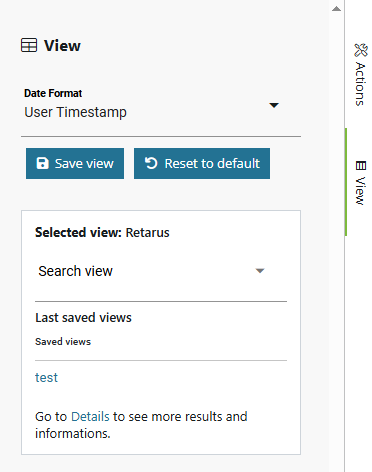
Saving your view
Save a customized report layout so you can return to it without reapplying settings each time.
-
After adjusting the table (for example, by showing/hiding columns, rearranging their order, and applying filters), go to the View panel on the right side of the screen.
-
Click Save view.
→ The Save view dialog opens.
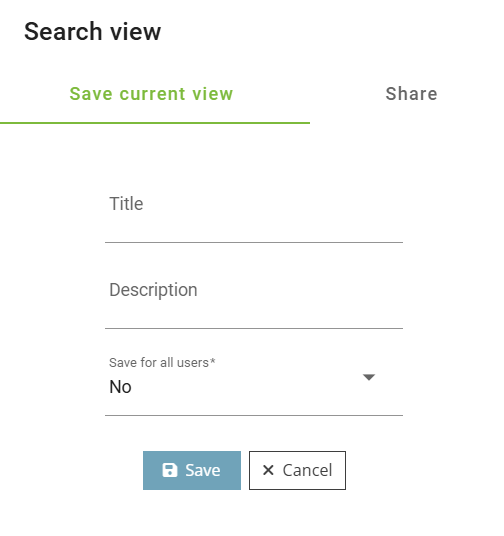
-
Enter a title for your view.
-
Enter an optional description to provide more detail about the view’s contents or use.
-
In the Save for all users dropdown, select:
-
No – the view is only available for you.
-
Yes – the view is available to all users under your customer number.
-
-
Click Save to store the view.
Once saved, the new view appears in the Last saved views list. Click on it to instantly load that table configuration.
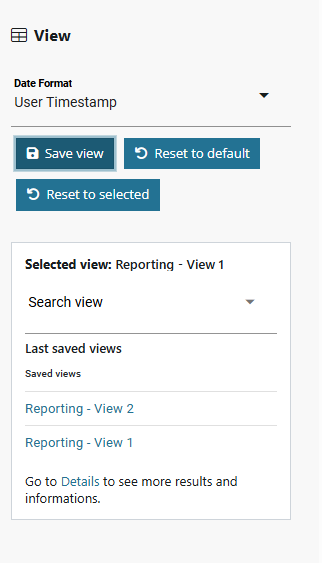
You can also use one of the following options in the View dialog:
-
Search view
Start typing a view name in the Search view field to quickly find the one you need. -
Reset to default
Restore the table to the original system view. -
Reset to selected
Revert the table to the most recently selected saved view, discarding unsaved changes. -
Details link
Opens the Saved Views window for more management options.
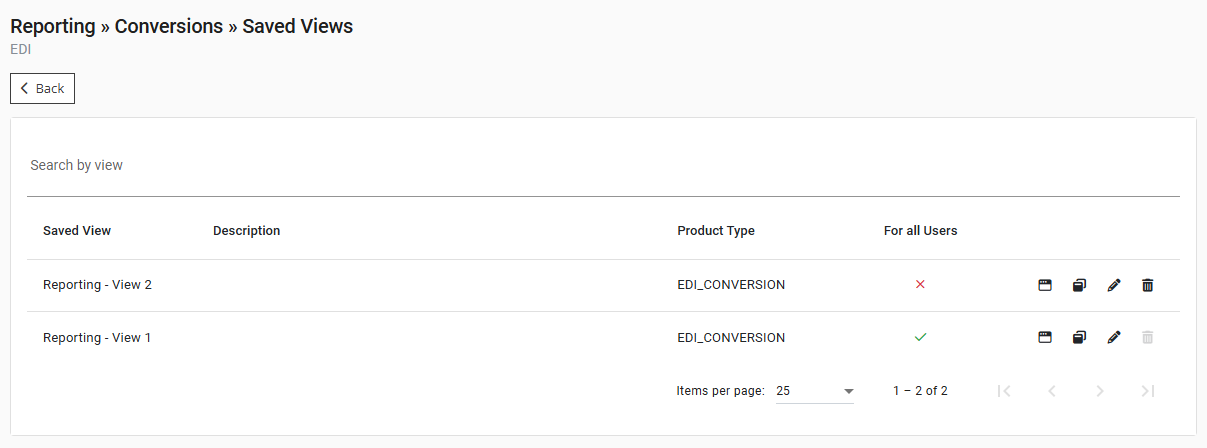
The Saved Views window shows all views available to you. From here, you can:
-
Set as default view – Makes this view load automatically when you open Reporting.
-
Set as current view – Immediately applies the selected view to your table.
-
Edit view – Change the name, description, and visibility (for all users or personal only).
-
Delete view – Permanently remove the view.
You can also search through all available saved views using the Search by view field at the top of the page.
Exporting data
You can export the currently visible data from the Reporting table to either Excel or CSV format for offline analysis or record-keeping.
-
Go to the Actions panel on the right side of the screen.
-
Choose the file format you need:
-
Excel – Downloads as a
.xlsxfile, which you can open in Microsoft Excel or similar spreadsheet tools. -
CSV – Downloads as a plain text
.csvfile, compatible with Excel, Google Sheets, and most data processing tools.
→ The download starts immediately.
-
Exporting larger datasets
-
The export includes only the rows currently loaded in the table.
-
The table displays up to 1,000 results per page.
-
To export more than 1,000 transactions, use the paging controls at the bottom of the table to load the next set of results.
-
You can repeat the export for each page until you reach a maximum of 10,000 transactions.
-
If your dataset exceeds 10,000 transactions, apply filters to narrow down your selection before exporting.
Data security and availability
myEAS stores source and target files in encrypted form on dedicated storage. You have access to all transactions and related files for the agreed retention period.