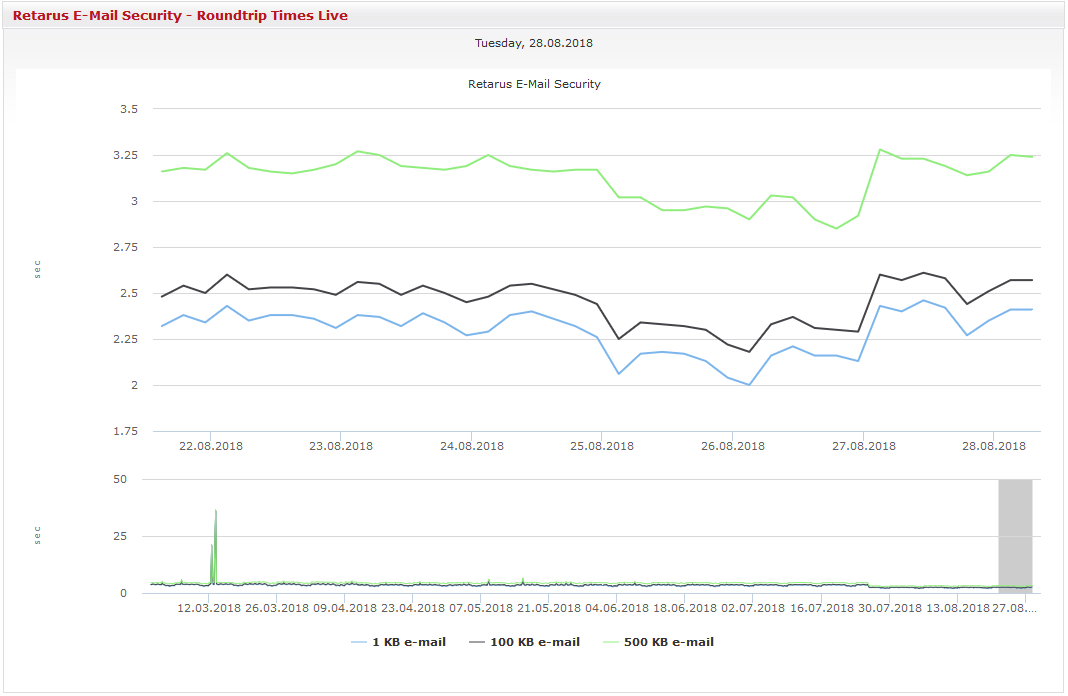
The performance monitor provides real-time data about Retarus Email Security. The graph below shows live throughput times within the Retarus infrastructure. The curves indicate the current and average throughput times for emails up to 1 KB, 100 KB, and 500 KB in size. The lower graph allows you to view a timeframe of your choice. To do so, just place your mouse over the desired start date and drag the cursor along to the intended end date.