Dashboard
Get a comprehensive view of critical metrics and data for your running SMTP Concentrator App. This interactive, browser-based dashboard details essential metrics. Alternatively, this data is also available in the standard Prometheus Data Format, ready for ingestion by your preferred observability platform.
Included in the Dashboard are the following:
-
a total Message Metrics overview (forwarded, rejected, failed);
-
authentications (user, network, failed);
-
a Live Log service;
-
Sender and System statistics;
-
an Authentication check;
-
configuration details;
-
as well as TLS certificate information.
The dashboard’s automatic refresh interval is optional (Off) and adjustable (from 1 second to 10 minutes).
📌 About data retention
As the SMTP Concentrator run into your own infrastructure, the data processed by the App do not leave your environment. The data are retained as long as you do not restart the App.
Landing page
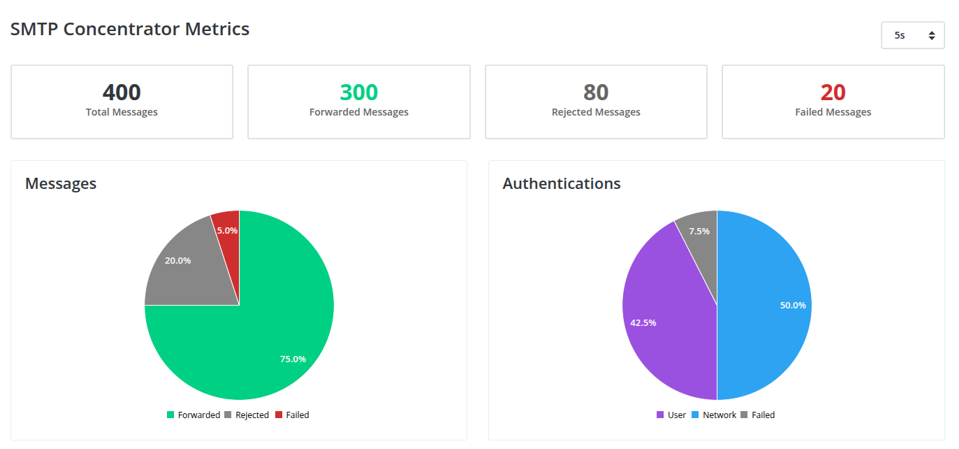
Message metrics Overview
Details how many total messages have been sent. Breaks down the total into the number of messages that have been forwarded, rejected, and/ or failed.
-
Rejected Messages: attempt to send a message that was unauthorized based on customer parameters. E.g. “misuse” by the sender;
-
Failed Messages: messages that did not reach the intended recipient. E.g. syntax error or invalid address.
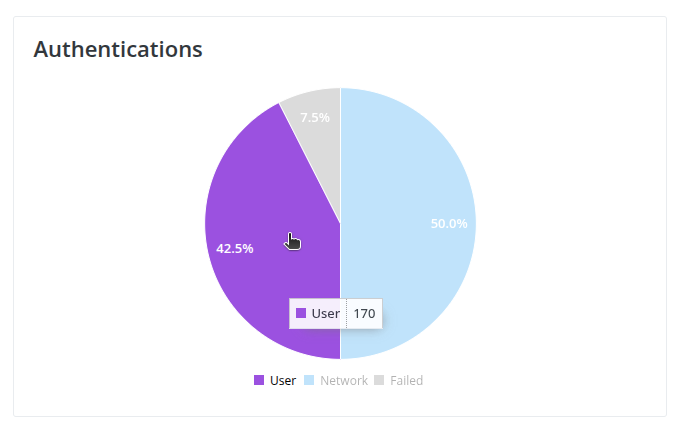
Authentications metrics
Displays the total number of authentication attempts, broken down by percentage into user, network, and failed attempts.
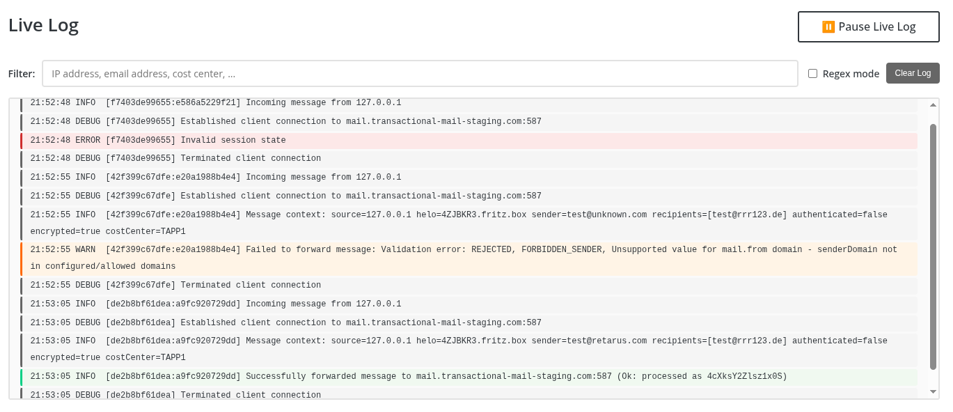
Live Log
Details all messages that are sent and their status (green, yellow, red):
-
Green: messages that are successfully forwarded (as defined above)
-
Yellow: messages that are rejected (as defined above)
-
Red: Messages that fail (as defined above)
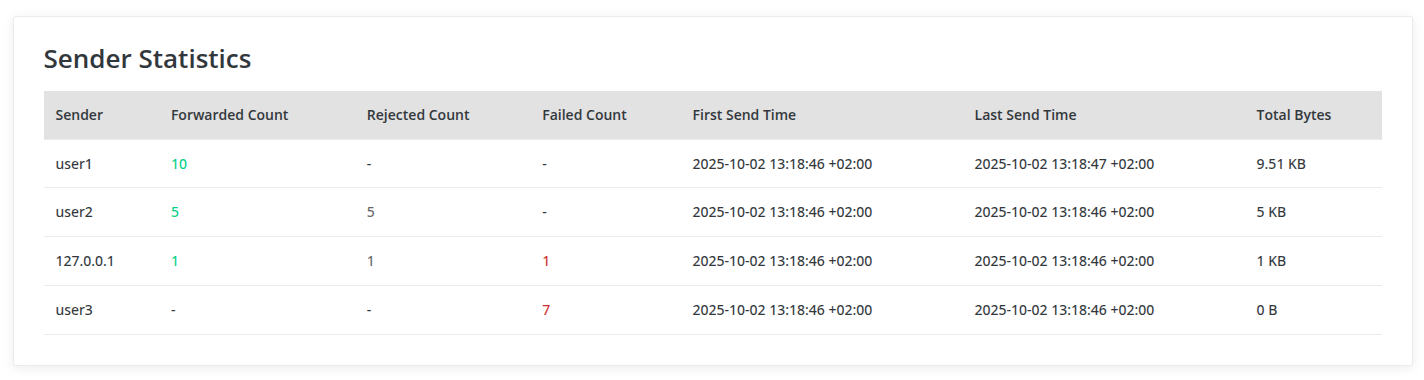
Sender Statistics
Lists the total number of users and/ or sender IP address (based on authentication method, Basic Authentication vs Source IP authentication) as well as the following critical details for each:
-
Forwarded messages (total)
-
Rejected messages (total)
-
Failed messages (total)
-
First message sent (time and date)
-
Last message sent (time and date)
-
Total data size (in bytes)
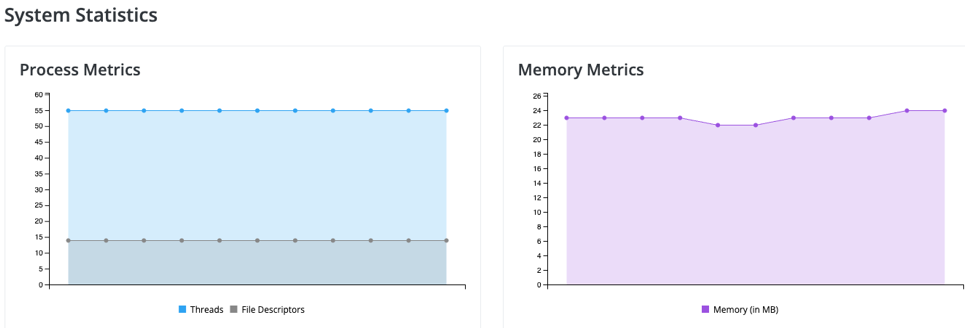
System Statistics
Visualizes the system’s Process (threads and file descriptors) and Memory metrics as a line graph. Serves as a system health check whereas when the line is flat, the system is stable. Peaks or spikes in the line indicate instability or system stress.
-
Process Metrics: the total number of threads and file descriptors that are operating in parallel.
-
Threads: worker units that can process different tasks simultaneously. When it comes to the SMTP Concentrator, every processed message requires one active thread for processing. An increased number of threads indicates more processed messages in parallel.
-
File Descriptors: represent open data streams. Every session requires at least two data streams for the connections. An increased number of file descriptors indicates more processed messages in parallel.
-
-
Memory Metrics: the total amount of memory that is being used (in megabytes).
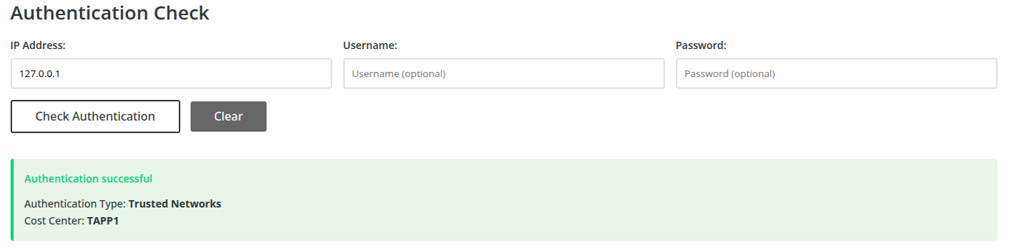
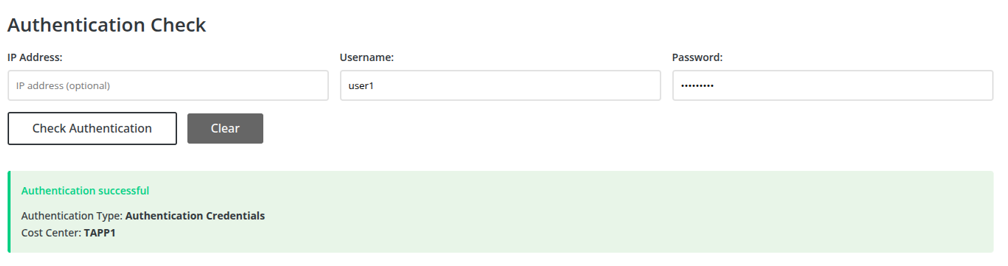
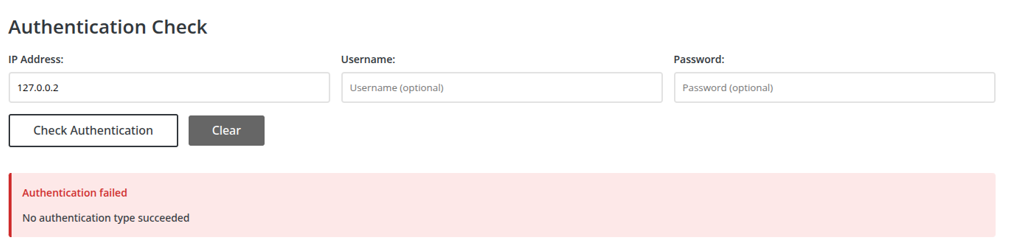
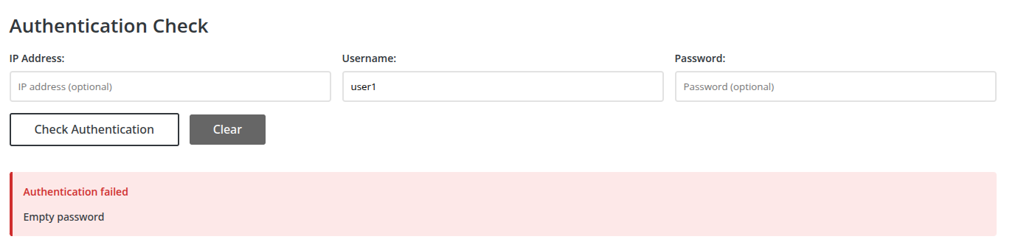
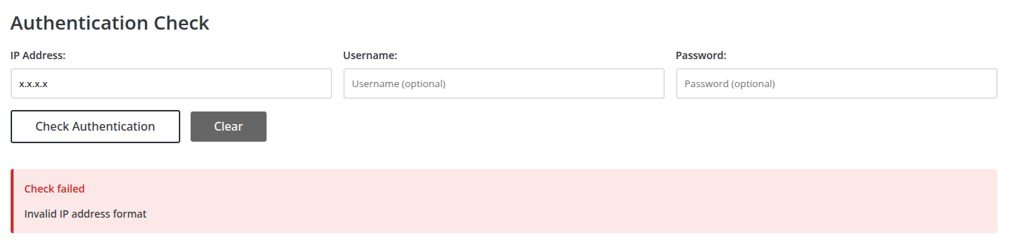
Authentication check
Instead of referencing the SMTP Concentrator configuration file, we offer administrators an interface to check the authentication result for an IP address or credentials.
-
Green: successful
-
Red: authentication failure
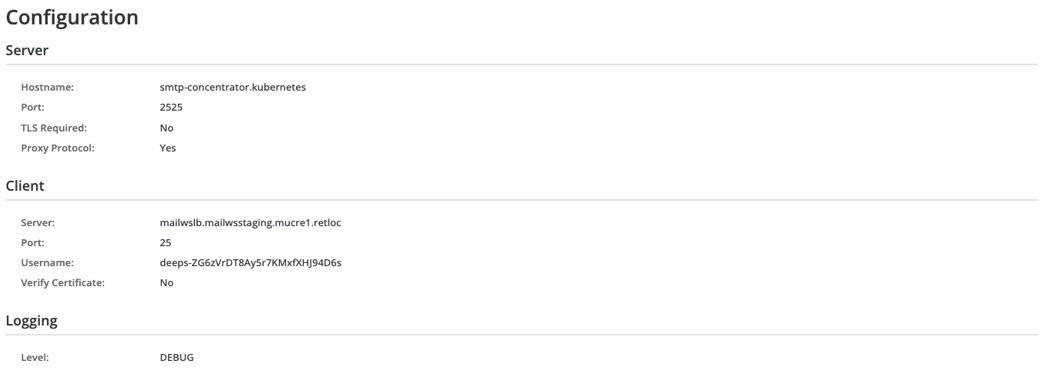
Configuration Details
This serves the purpose providing you a summary of all Servers, Clients, and Logging details listed for the SMTP Concentrator instance.
-
Server details: host name, port, TLS requirement, proxy protocol
-
Client details: server, port, user name, certificate verification requirement
-
Logging: shows the level status
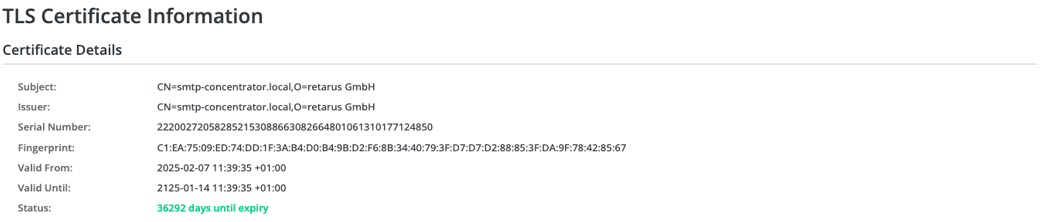
TLS Certificate Information
Lists the details of the SMTP Concentrator’s TLS Certificate. Information includes:
-
Subject
-
Issuer
-
Serial Number
-
Fingerprint
-
Validity date (issue date and expire date)
-
Status (number of days until expiry)
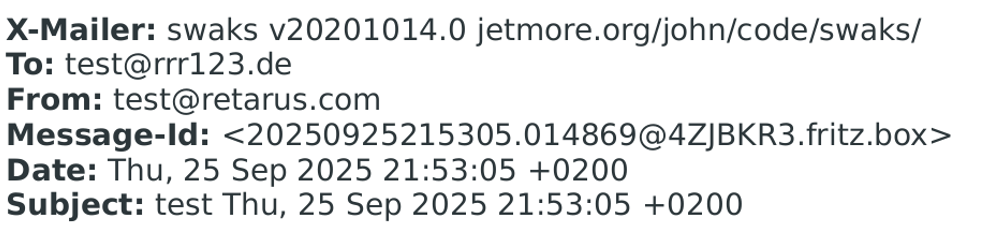
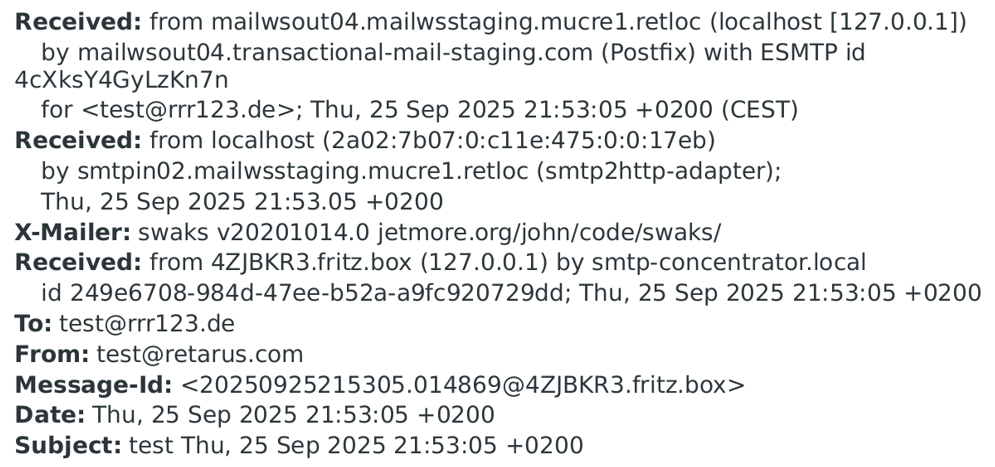
Privacy feature - Headers stripping
In addition to adding RFC-compliant 'Received' Headers, the SMTP Concentrator now includes a configurable function to remove internal 'Received' and related Headers.
This is especially useful when emails pass through several internal hops before leaving your enterprise network. These internal headers, which may contain confidential information such as IP addresses or server names, are deleted before the email reaches the Transactional Email service, ensuring they don't leave your environment.
This optional feature is enabled by selecting the 'Remove Internal Headers' option.
Functionality: All 'Received' headers generated during internal hops prior to the message reaching the Concentrator are removed from the email.
📌 All-or-nothing
When you enable the 'Header stripping' feature, the SMTP Concentrator instance removes all internal headers from any message it processes.
Before, privacy feature not enabled
After, with privacy feature enabled
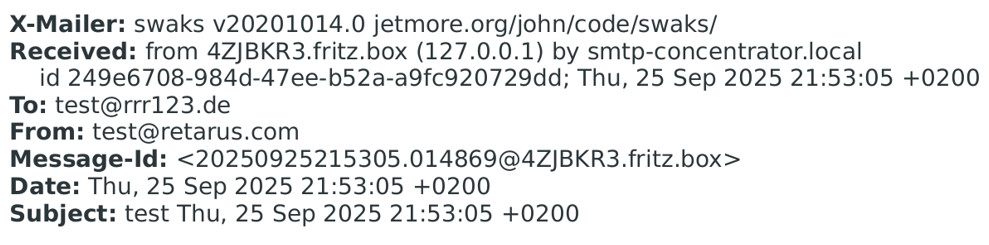
With the config option “addReceivedHeader: false” the concentrator removes the “Received” header of its own.