
The user interface (“console”) of the PZD Real-Time Response contains the following sections that you can access vie the menu on the left side:
-
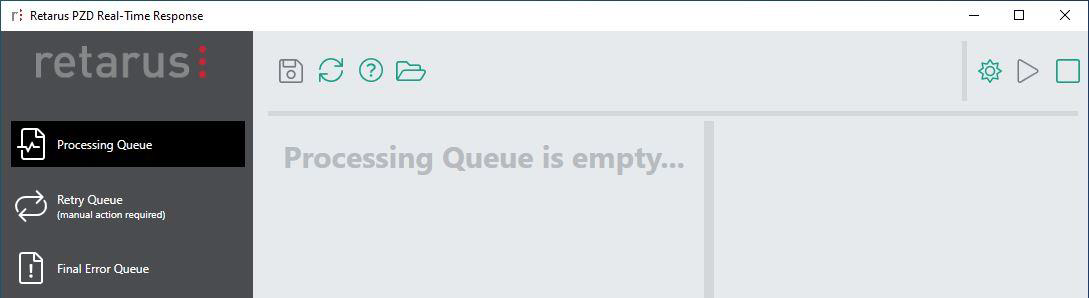
Processing Queue
Live monitoring for the PZD Real-time Response. -
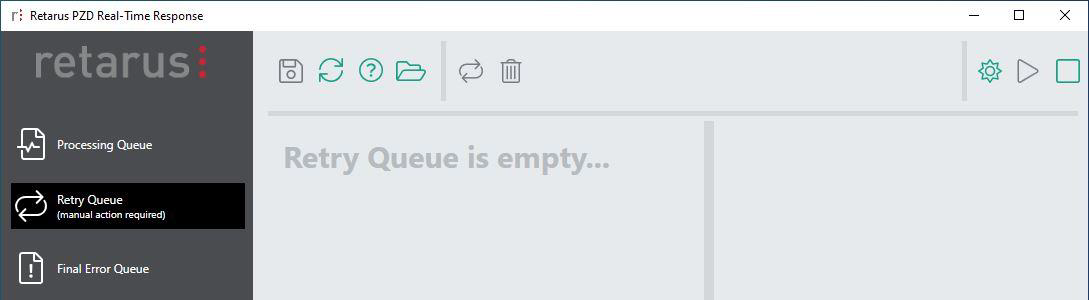
Retry Queue
Restart event processing manually after a temporary error occurred. -
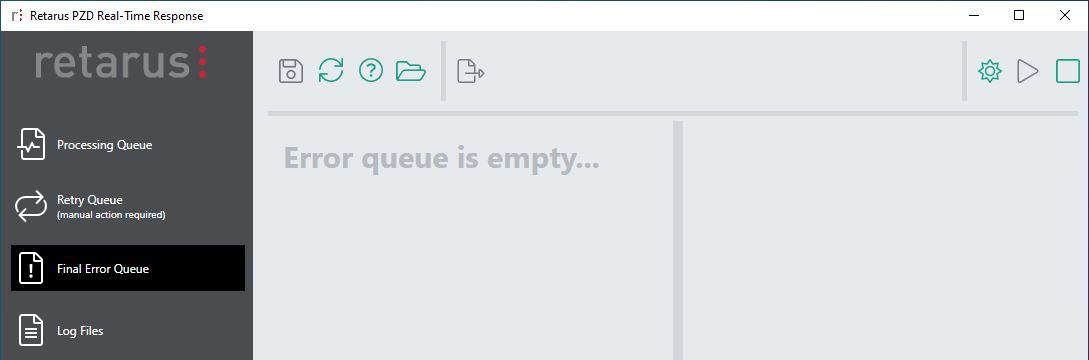
Final Error Queue
Event files in this directory cannot be processed and have to be deleted or adapted manually. -
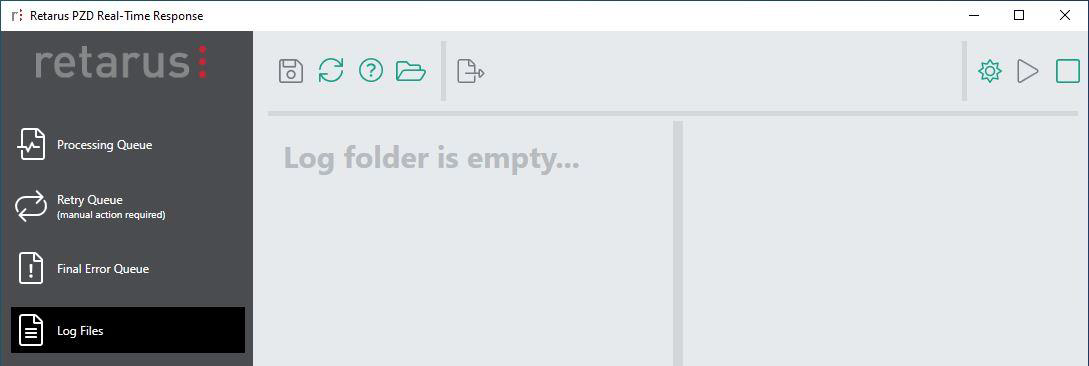
Log Files
Detailed log data of the application and its processing steps in chronological order. -
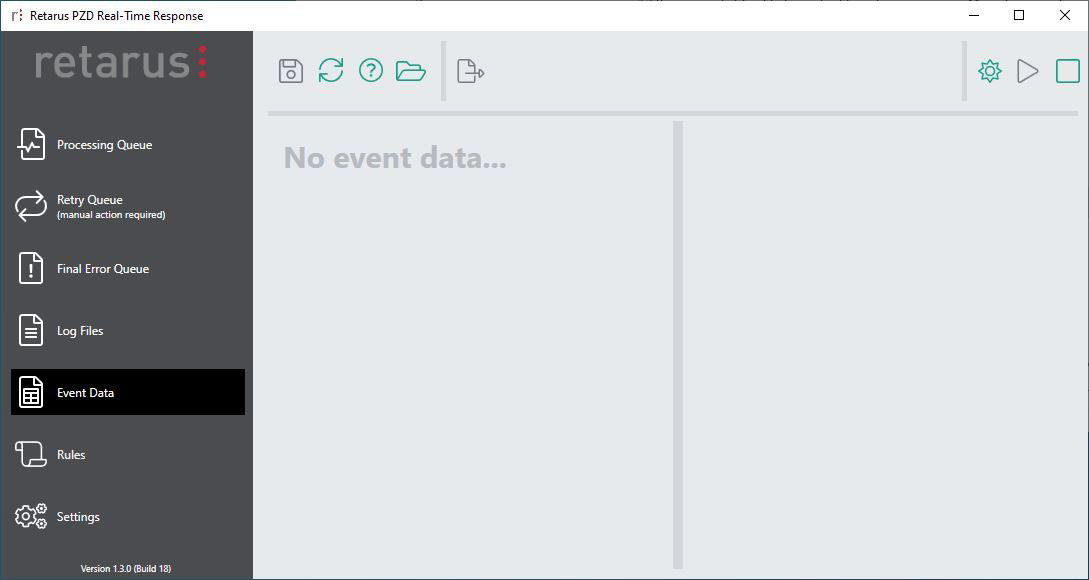
Event Data
Details about all received and processed events sorted by event (Job ID) in chronological order. -
Rules
Configuration of the actions to be executed (movement/deletion of infected emails etc.). -
Settings
Configuration options for the application itself (connection, log settings etc.).
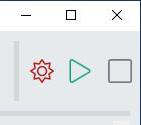
Apart from the navigation menu on the left side, there is a status indicator for the PZD Real-Time Response Windows service placed in the upper right corner of the interface. It shows the status of the service (red sun = not running, orange sun = starting/stopping, green sun = running) and allows to start or stop it manually (administrator permissions required) without having to switch to the external Windows services console.
Processing queue
The processing queue contains all PZD events that are processed right now or still have to be processed, it therefore serves as “live monitoring”. Events are shown here only for the very short time; a small counter shows their number.
In case of an error (SIEM or Exchange connection not working etc.), several automatic retries are done. If the problem persists, the events that cannot be processed, are moved to the Retry Queue (see below) and have to be re-processed manually when the root cause of the issue has been solved.
Retry queue
The retry queue is normally empty; if one or more events exist, a small counter shows their number.
Only in case of an error (e.g. connection problem to Retarus SIEM webservice), events are put into this queue. In this case, an error is logged in the Windows event log (see Log Files) and an email error notification is sent to the email address specified under Settings – Notifications (see Settings).
For sending out the notifications, your Exchange server is used. If the Exchange server itself is not available, these notifications are not sent. Therefore, we suggest monitoring the Windows service separately in addition to the email-based notifications, as critical errors are also logged there.
In order to process them correctly and have your rules applied, a manual action is required from you: To reprocess an event, select it in the queue and click on the Reprocess button in the top bar. If you don’t want an event to be processed any more, you may delete it from the queue using the delete (recycle bin) button on top.
Final error queue
This folder contains events that could not be processed, because the data itself is corrupt; for example invalid json files. As it will not be possible to process them in any case, these files should be removed manually from the Errors folder on disk (easily accessible by clicking on the folder icon in the top bar). The final error queue is normally empty; if one or more events exist, a counter shows their number.
Log files (including list of error codes)
If you would like to get detailed information about the application itself and all processing steps, you may find them in the log file. One log file is created per day. In the Log Files tab of the PZD Real-Time Response console, all existing log files are listed. If you select one, its full content is shown on the right of the screen. You may also open it in your default editor by clicking on the Open button in the menu above. Of course, you may also find those log files directly on your system without having to open the console, they are stored in the hidden ProgramData folder; by default, it is C:\ProgramData\Retarus\PZDRealTimeResponse.
If you would like to get processing details of a certain email, you may search in the daily log file for the Message ID. Here, also the corresponding Job ID is shown in the log. In order to get all the information for this job at one glance (and not have to search the log file for all related log lines), search for this Job ID afterward on the Event Data tab (see Event Data).
"LOGONLY" in a log line indicates that the Log-only mode is activated for the corresponding rule, so the action has not been executed and notifications haven’t been sent. (See Rules for more details.)
In the log files, you also get further information if an error appears.
These are some common ERROR log lines:
-
[RetarusForensicSIEMIntegration] Possible SIEM connection failure, 0 try to reconnect. The remote server returned an error: (401) Unauthorized.
→ Related to the connection to the Retarus SIEM Service. Either the webservice URL or the provided token are invalid. -
Function[ConnectToEWS/ProcessForensicSIEMFiles] Try; 0 The Autodiscover service couldn't be located.
→ Related to the connection to the Exchange server; the server could not be retrieved by the Autodiscover functionality. -
Function[ConnectToEWS/ProcessDailyDigest] Try; 0 The Autodiscover service couldn't be located.
→ Related to the connection to the Exchange server; the server could not be retrieved by the Autodiscover functionality. -
Function[ConnectToEWS/ProcessForensicSIEMFiles] The e-mail address is formed incorrectly. FormatException.
→ Related to the connection to the Exchange server; invalid administrator email address. -
Function[ConnectToEWS/ProcessDailyDigest] The e-mail address is formed incorrectly. FormatException.
→ Related to the connection to the Exchange server; invalid administrator email address. -
ERROR RetarusCommon.ServiceConnectionException: Service connection can't be established. ---> Microsoft.Exchange.WebServices.Data.ServiceRequestException: The request failed. The remote server returned an error: (401) Unauthorized. ---> System.Net.WebException: The remote server returned an error: (401) Unauthorized.
→ Related to the connection to the Exchange server; invalid administrator email address or password. -
The specified object was not found in the store. The process failed to get the correct properties.
→ Related to the connection to the Exchange server; the administrative user does not have sufficient privileges to access and move/delete emails of the recipient. -
Function[EWSFindMessages/ProcessForensicSIEMFiles] Can't find MessageId [<123not_existing456>] in UserMailbox [user@domain.com]
→ Related to the connection to the Exchange server; no email with the reported Message ID could be found in the mailbox of the recipient. -
Function[EWSGetFolderId/ProcessForensicSIEMFiles] MailBox[admin@domain.com] FolderPath[sample_folder] Subfolder sample_folder not found
→ Related to the connection to the Exchange server; the subfolder “sample_folder” specified in the rule does not exist. -
Function[EWSMoveOrDeleteMessage/ProcessForensicSIEMFiles] Admin folder does not exist.
→ Related to the connection to the Exchange server; the (admin) folder specified in the rule could not be found. -
The SMTP address has no mailbox associated with it.
→ Related to the connection to the Exchange server; the reported user address/mailbox could not be found.
Event data
The Event Data tab contains details of all received and processed SIEM events, event by event—details of the event itself, as well as information about the applied rules and processing. The data files are sorted by date (latest on top) and Job ID. This job number can be found in the log files (see Log Files). When opening the Event Data folder, it takes some seconds to load all files.
You may also open the original JSON file in your default editor by clicking on the Open button in the menu above.
Of course, you may also find those files directly on your system without having to open the console, they are stored in the hidden ProgramData folder: C:\ProgramData\Retarus\PZDRealTimeResponse.
The corresponding filename to a job ID is shown as part of the details.
Events are deleted automatically after a configurable time; see Logging Preferences for details.
Rules
On this tab, the functionality of the PZD Real-Time Response is defined by creating one or more rules.
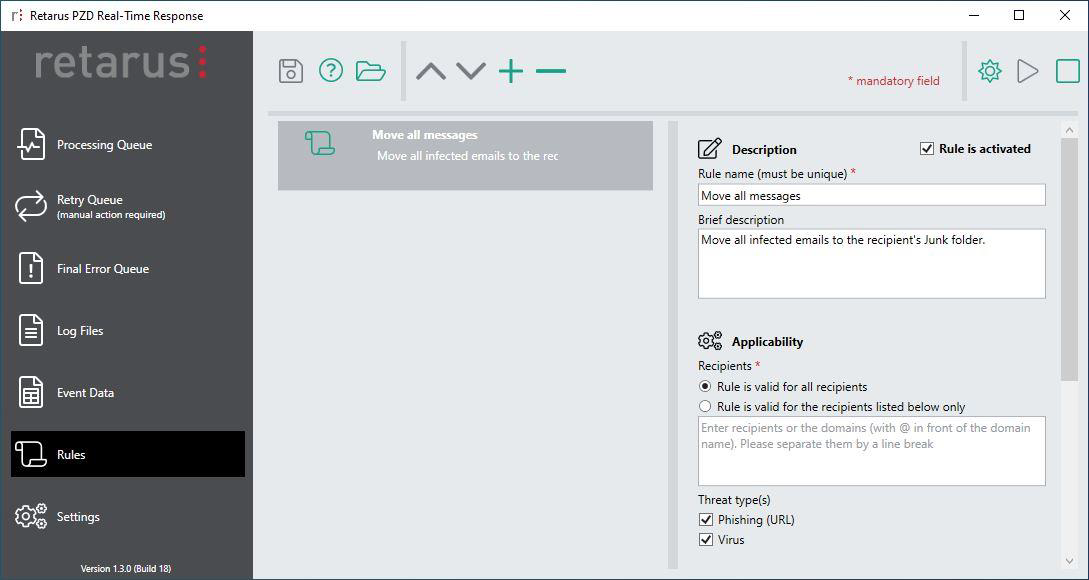
Existing rules are displayed as a list on the left side of the dialogue, while details/settings of the selected rule are displayed on the right side of the screen.
The icon on the left side of the list view shows if the rule is active (green icon) or deactivated (grey icon). When starting for the first time, a default rule is created that moves all detected phishing and/or virus-infected emails to the Junk folder of the respective Exchange user.
You may create one or more individual rules with different settings. The first rule that matches an email is executed. If there are other rules below, these are not taken into consideration and more.
The buttons on top of the screen enable you to save your current rules, refresh the screen, change the order of your rules (as they are applied in the order of the list), add an additional rule or remove (delete) a rule.
Rule settings
-
Rule is activated
By disabling this checkbox, you deactivate a rule. The rule is not applied any more, but saved for a potential reactivation in the future. The icon on the left side of the list view also shows if the rule is active (green icon) or deactivated (grey icon). -
Description
Enter a unique rule name (mandatory) and an optional description. -
Applicability
-
Recipients
Decide if this rule shall be applied to all recipients or if you would like to apply it only to a group of recipients. If you’d like to choose only some recipients, please enable the second radio button and list the recipients (either email addresses or domains) in the list box, separated by line breaks. Domains have to be listed including an “@” symbol at the beginning. -
Threat Type(s)
Decide if the rule shall be applied to phishing, virus-infected emails or both types.
-
-
Actions
-
Delete the message
Delete detected email. Attention: This is a “hard delete”, meaning that the email is deleted straight away and not just moved to the user’s Paper bin. Before activating this option, check internally if you are allowed to delete infected emails automatically (data privacy/compliance). -
Move the message to the recipient’s Exchange folder
Choose one of the standard Microsoft Outlook folders, e.g., Junk. -
Move the message to the recipient’s Exchange folder and a specified subfolder
Choose a subfolder of one of the standard Microsoft Outlook folders. If the folder doesn’t exist, the email is moved to the recipient’s Junk folder. -
Move the message to the recipient’s specified folder
Choose any folder in the recipient’s mailbox. If the folder doesn’t exist, the email is moved to the recipient’s Junk folder.
The following additional actions are only available for Exchange on-premise: -
Move the message to the administrator’s Exchange folder
Choose one of the standard Microsoft Outlook folders, e.g., Junk, but not inside the recipient’s mailbox, but in another user’s mailbox, commonly an administrator. -
Move the message to the administrator’s Exchange folder and a specified subfolder
Choose a subfolder of one of the standard Microsoft Outlook folders, but not inside the recipient’s mailbox, but in another user’s mailbox, commonly an administrator. If the folder doesn’t exist, the email is moved to the recipient’s Junk folder. -
Move the message to the administrator’s specified folder
Choose any folder, but not inside the recipient’s mailbox, but in another user’s mailbox, commonly an administrator. If the folder doesn’t exist, the email is moved to the recipient’s Junk folder.
-
If you are using Microsoft 365 Exchange Online and you are updating a previously installed older version (<1.3) of the PZD RTR
For Exchange Online, the Microsoft Graph API does not support moving emails to another user’s Inbox or any other folder. Therefore, if you created a rule in the past that uses the action to move an email to an administrator’s mailbox, please change this rule prior to installing the latest version. If such a rule is executed afterward, instead of moving the email to the administrator’s mailbox, it will be moved to the recipient’s junk folder as a fallback.
-
Notifications
Activate a notification for the concerned user and/or a notification of another user, commonly the administrator.
If you activate Recipient (User) notification, one notification email is sent for every event.
If you activate Additional notification, you may enter another email address (normally the administrator’s address) and choose between the option to receive one notification email for every event or to receive only a so-called “daily digest”. A daily digest is always created at 0:00 in the morning and includes all events of the last 24 hours where this rule has been triggered. This means that you are able and have to configure these notification emails (user and admin notifications, single email or daily digest) for all your rules separately. If you choose to receive a daily digest for more than one rule, you may get more than one digest a day.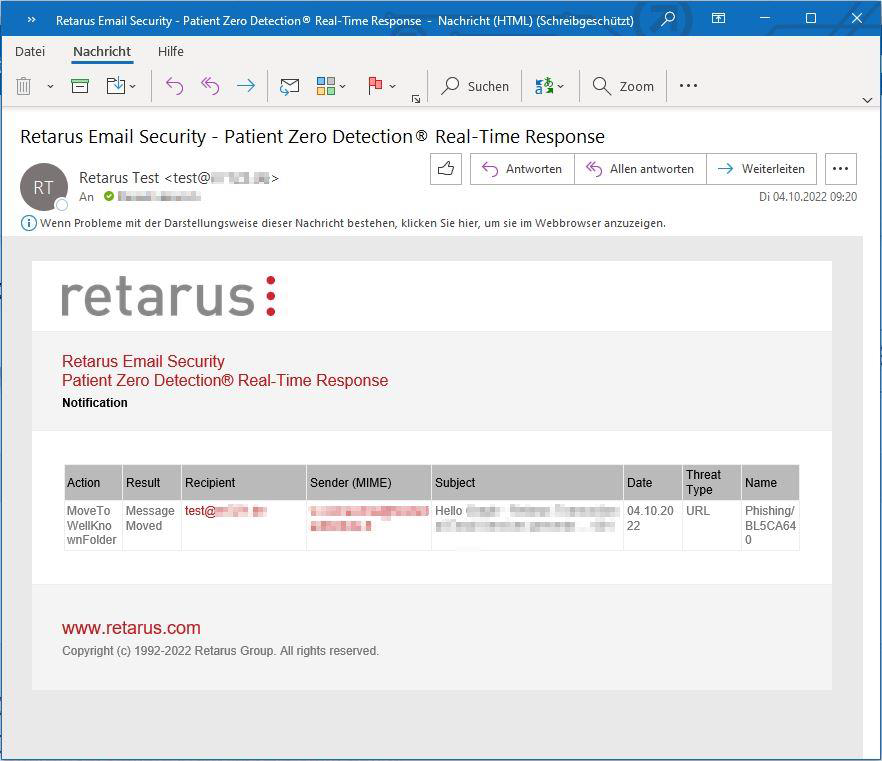
Notifications may also be activated for the Retarus Patient Zero Detection® service in general. You may vote for the standard PZD notifications or the notifications of the PZD Real-Time Response which include the executed action (and might therefore be more useful). Both notifications at the same time are probably not useful as recipients then get the information about the event itself and right afterwards about the processing result of the PZD Real-Time Response.
-
Testing and warming up purposes
Activate the log only checkbox for testing purposes. If this checkbox is activated, no actions are taken in reality, but the actions the PZD Real-Time Response would have taken are logged.