
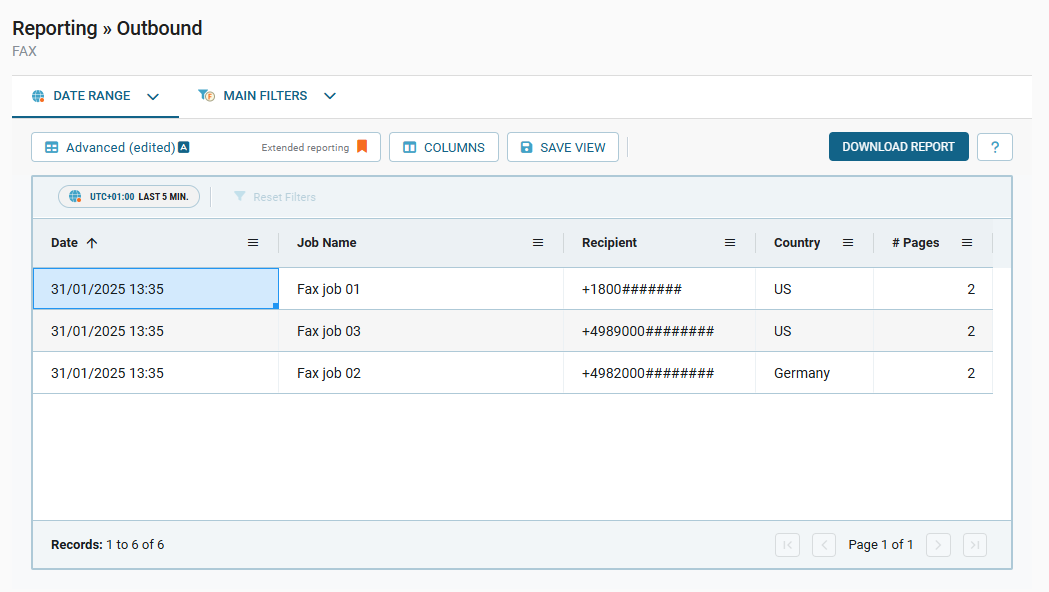
Report tables provide a structured way to display and manage reporting data. They include features for sorting, filtering, customizing, and exporting data so you can view information in the most useful format for your needs.
Understanding the table layout
When you open a page with a report table, you’ll typically see:
-
Column headers
Define the type of data in each column (e.g., Date, Job Name, Recipient, Country, # Pages). -
Rows of data
Each row represents an individual record, containing details for the report or dataset. -
Sorting indicators
Clickable column headers with arrows (↑/↓) to control sorting order (ascending or descending). -
Navigation controls
Pagination controls at the bottom to move through multiple pages of data.
Example - Outbound Reporting in Cloud Fax
Setting data ranges
Use the Date Range feature to specify the time period for your report. Choose from predefined options or set custom dates and times.
Accessing date range options
-
Navigate to the top of the page.
-
Select the Data Range tab.
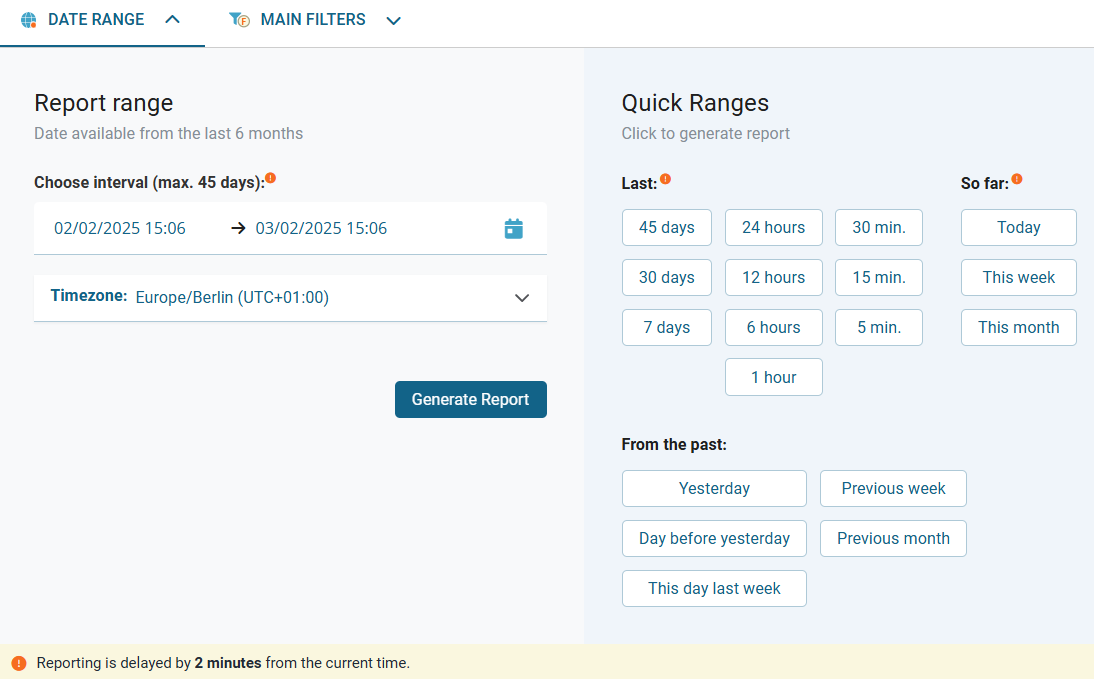
Using quick ranges
Select a predefined quick range from Quick Ranges to immediately apply it and generate the report.
Selecting a custom date range
-
Click inside the date and time field to open the date picker.
-
Select the start date and time.
-
Select the end date and time.
-
Ensure the selected interval is no more than 45 days and falls within the last 6 months.
-
Optional: Click the Timezone dropdown and select the appropriate timezone for your report.
-
Click Generate Report to apply the date range and generate the report.
Important notes
-
Data availability
You can generate reports for any window of up to 45 days within the last 6 months. To cover a longer period, generate multiple reports. -
Processing delay
Data may be delayed by a few minutes, as noted in system notifications. -
Timezone accuracy
Select the correct timezone for accurate results.
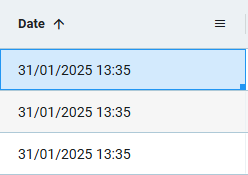
Sorting data in tables
Some columns can be sorted in ascending or descending order:
-
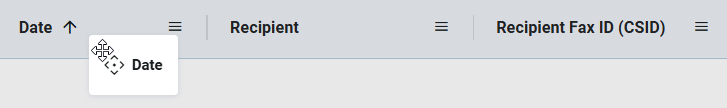
Click a sortable column header (e.g., Date) to sort.
→ The arrow (↑/↓) indicates the current sort direction. -
Click again to reverse the sort order.
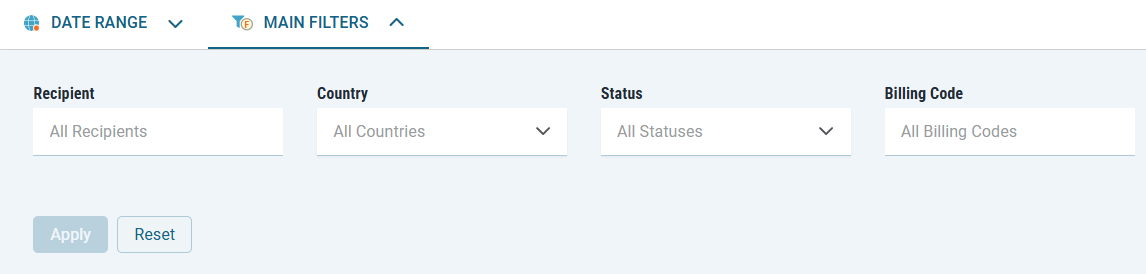
Using filters to refine data
Filters narrow your results based on specific criteria. Available filters vary by view and function (e.g., monitoring and reporting sections may have different filtering options).
-
Click Main Filters to open the filtering panel, e.g.:
-
For manual input fields (e.g., Recipient, Billing Code):
-
Type your search term.
-
-
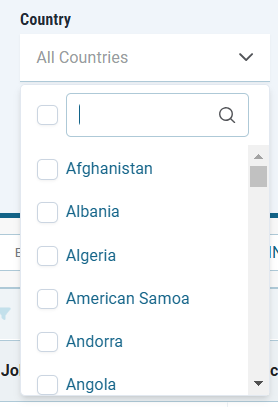
For dropdown fields (e.g., Country, Status):
-
Click the field to open the dropdown.
-
Scroll or use the search bar to find a value.
-
Select one or more options.
-
-
Click Apply to update the table.
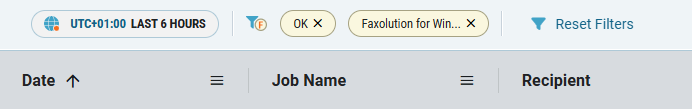
→ The filtered results display in the table.
→ Applied filters appear at the top of the table.
Clearing filters
-
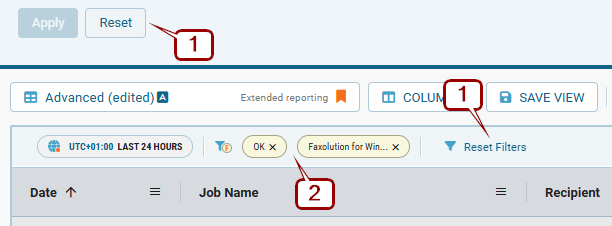
Clear all
[1] Click Reset in the filter panel or Reset Filters at the top of the table. -
Clear one
[2] Click the filter label at the top of the table.
Customizing columns
You can show, hide, and rearrange columns to focus on the most relevant data.
Showing or hiding columns
-
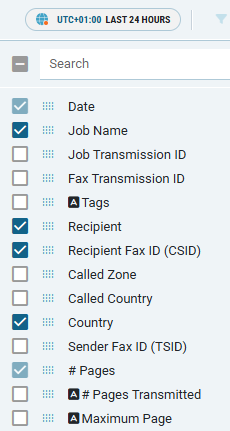
Click COLUMNS at the top of the table.
→ The column selection sidebar appears on the left, displaying a list of all available columns.
-
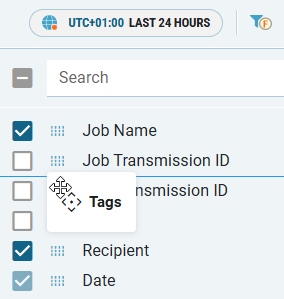
In the column selection sidebar:
-
Check a box to display a column.
-
Uncheck a box to hide a column.
-
The table updates automatically as you make changes.
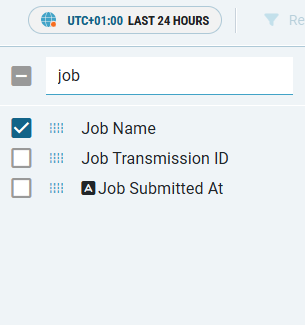
Searching for columns
Use the search bar in the sidebar to quickly locate columns. Only matching columns are shown.
Rearranging columns
-
In the table: Drag and drop the column header to a new position.
-
In the sidebar: Drag the handle icon next to a column name to move it.
Downloading reports
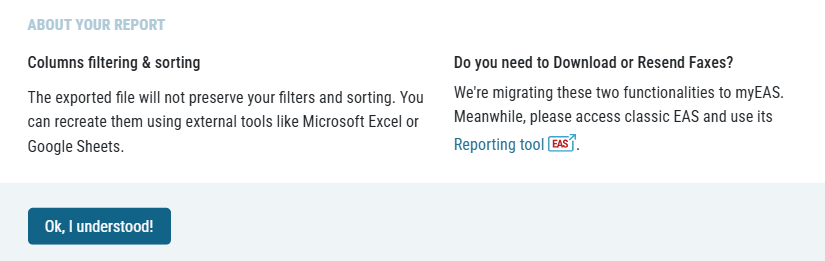
Export table data for use in spreadsheets or reports.
-
Click Download Report at the top of the table.
-
Select a file format (CSV or Excel).
→ The file is downloaded to your device.
For more details, click the ? icon next to Download Report.
File format limits
-
Excel: up to 250,000 records
-
CSV: up to 500,000 records
If you try to download a report that exceeds these limits, you see an error message indicating that the maximum number of records has been exceeded.
Recommendations for large datasets
If you work with large datasets, export reports as CSV files or reduce the selected time range. You can also request multiple reports for smaller periods to stay within the maximum limits and ensure successful downloads. If you need further assistance, contact the support team.