
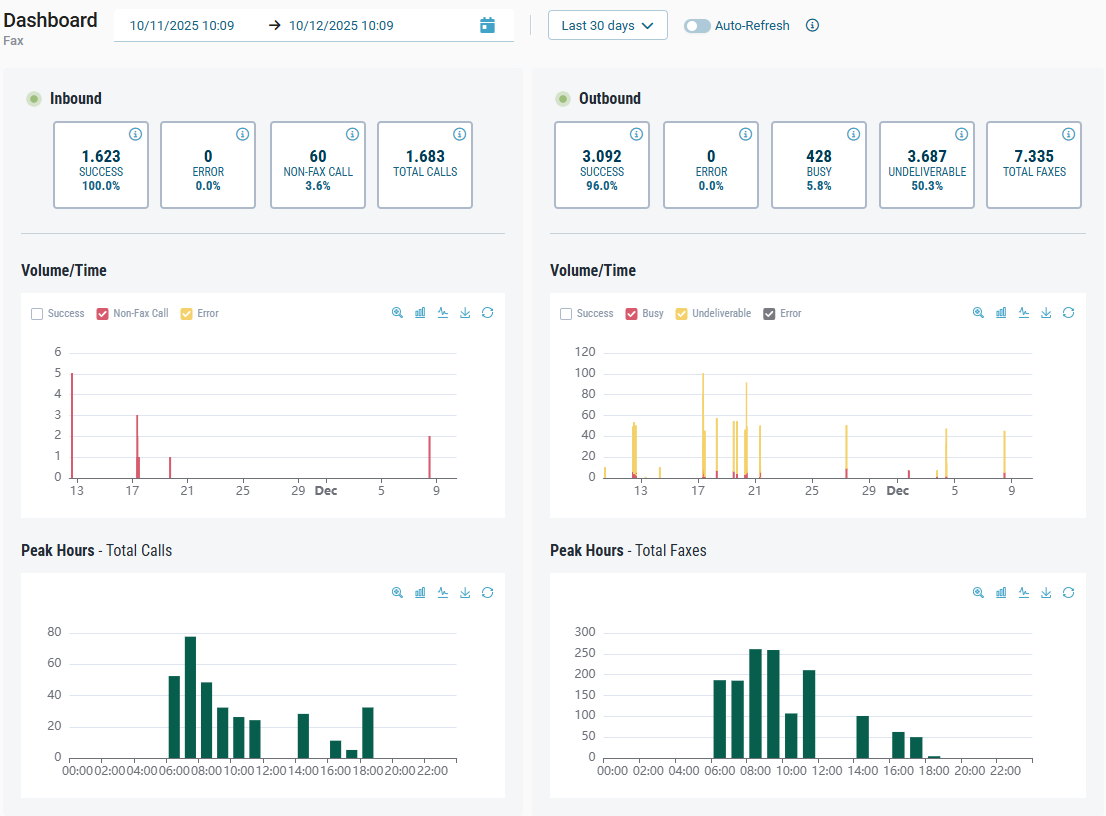
The Cloud Fax Dashboard provides a real-time overview of your inbound and outbound fax traffic. It helps you monitor fax delivery performance, identify error patterns, and analyze activity over time. The dashboard combines high-level status cards with charts and reporting tools to support both operational monitoring and detailed troubleshooting.
📌 General information about components and interactions
The dashboard uses shared components and interactions available across all Retarus products. For general information about chart controls and visualization features, refer to Working with charts.
Cloud Fax dashboard access
If you don’t see any information on the Cloud Fax dashboard, it usually means you don’t have the required permission. Access to the dashboard is controlled by the See Dashboard Statistics user right in Classic EAS (EAS - User Management - Fax). By default, this setting is disabled.
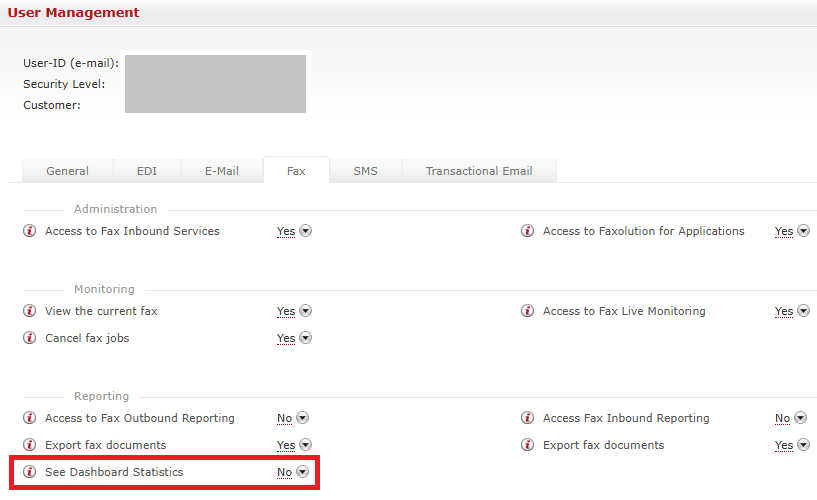
When this permission is set to No, the dashboard appears empty. This is expected behavior, as other dashboard features, such as Fax Inflight Monitoring and Reporting, have been moved to different areas of myEAS.
To view dashboard data, an administrator must explicitly enable the See Dashboard Statistics permission for your user account. If you are an administrator, you should already have access automatically, regardless of this setting.
Dashboard layout overview
The Cloud Fax dashboard is divided into several key areas:
-
Timeframe selection and auto-refresh controls
-
Inbound overview cards summarizing call and fax results
-
Outbound overview cards summarizing fax sending results
-
Volume and peak-hour charts for inbound and outbound traffic
Timeframe and auto-refresh
You can adjust the displayed timeframe using either quick ranges or a custom date and time range. Auto-refresh is available when a quick range is selected, ensuring that your data updates continuously during active sending periods.

For detailed information on timeframe controls and auto-refresh behavior, see Working with charts.
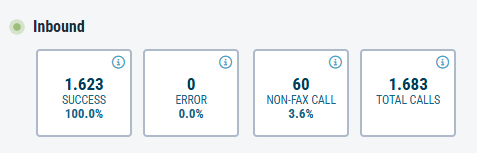
Inbound overview
The Inbound panel provides a breakdown of calls and fax results received within the selected timeframe. Each card displays the total count and a percentage value relative to total fax calls and transmissions.
Cards definition
|
Card |
Description |
|---|---|
|
SUCCESS |
Total number of successfully received faxes. The success rate is calculated as the number of successful faxes divided by the total number of calls minus non-fax calls. |
|
ERROR |
Incoming calls where a fax connection could not be established, or the transmission did not complete successfully. |
|
NON-FAX CALL |
Incoming calls that do not appear to be fax transmissions. |
|
TOTAL CALLS |
Total number of incoming calls. |
For more information about the available statuses for Inbound Fax, see https://docs.retarus.com/fax/transmission-status-codes.
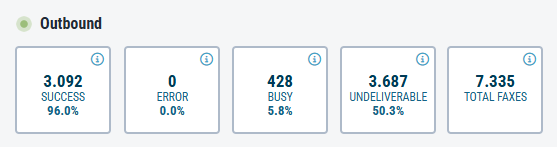
Outbound overview
The Outbound panel summarizes fax sending activity. Each card displays counts and percentages relative to Total Faxes.
|
Card |
Description |
|---|---|
|
SUCCESS |
Total number of successfully delivered faxes. The success rate is calculated as the number of successful faxes divided by the total number of calls minus busy and undeliverable calls. |
|
ERROR |
Total number of faxes that could not be delivered due to a fax transmission error, a processing error, or similar issues. |
|
BUSY |
Faxes that could not be delivered because the destination line was busy. |
|
UNDELIVERABLE |
Total number of faxes that could not be delivered because the destination number was incorrect, not a fax device, the attachment was not supported, or for similar reasons. |
|
TOTAL FAXES |
Total number of fax transmissions. |
For more information about the available statuses for Outbound Fax, see https://docs.retarus.com/fax/transmission-status-codes-outbound-fax.
Fax activity charts
Cloud Fax provides two charts to help you analyze traffic patterns in more detail:
-
Volume/Time (Inbound and Outbound)
-
Peak Hours (Inbound and Outbound)
These charts help you understand when fax activity is highest, visualize success and error distribution, and detect unusual patterns.
📌 For chart interactions, such as showing or hiding metrics, switching chart types, zooming, or downloading, see Working with charts.
Volume/Time chart
The Volume/Time chart displays inbound or outbound fax activity grouped by status. Each bar represents a time interval (e.g., hourly), showing:
-
Total calls or faxes
-
Distribution of outcomes (Success, Error, etc.)
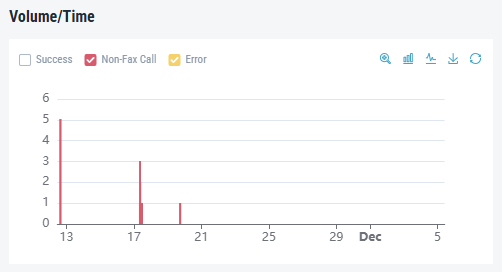
Use this chart to:
-
Identify peak sending or receiving periods
-
Compare successful transmissions against errors
-
Detect sudden changes in error rates
Peak hours chart
The Peak Hours chart highlights the busiest times of day for fax traffic. It shows total calls or faxes per hour, grouped separately for inbound or outbound activity.
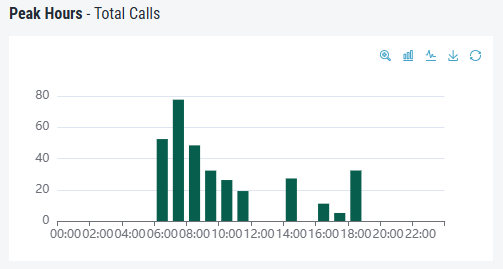
This chart helps you:
-
Understand when you typically send or receive faxes
-
Plan capacity or operational coverage
-
Monitor recurring patterns in fax usage
Investigating fax delivery issues
If the dashboard shows unexpected behavior, such as spikes in errors or sudden drops in successful transmissions, follow these steps:
-
Select a timeframe where issues occurred.
-
Review the inbound and outbound cards for increased error percentages or unusual success rates.
-
Use the charts to identify trends and pinpoint when issues started or examine patterns across hours.
-
Toggle metrics in the chart legend to reveal or isolate specific error categories.
-
Open Reporting for detailed logs of call attempts, fax statuses, and error codes.
-
Correlate with fax sending volumes to determine whether high traffic, line congestion, or endpoint issues contributed to errors.